Tuesday, April 19, 2011

Google Data.gov - How Hard is That?

Never before in human history has democracy had the tools available, where ordinary voters can so easily examine the workings of government in such detail. We are seeing the first few steps in a larger change in the fundamental way this information is managed.

Google Public Data Explorer launched February, 2011.

Tax day has come and gone and my dear old Uncle Sam and I have settled our accounts for another year. Everyone has an Uncle Sam, a nice old guy who doesn't manage his money so well so I help him out once in a while, just to, you know, make ends meet. You can't say no to Uncle Sam, with his white beard and stove pipe hat.

I don't know politics but I do know the Internet, which is full of crazy political rants. If you want to lose faith in humanity, just go to the Internet, find people who identify with a political party, and read what they writes about the other. Good times.

But hey, real issues, real money. What do I know?

What do I know just changed dramatically. Imagine if every dollar spent in the government, every receipt, every outlay, were recorded and place at my fingertips. What if I could chart all the government expenditures and revenues using any level of detail or axis of measure I choose?

You can get a taste of this with Google Public Data Viewer. It lets you mouse over the data, select, and change the perspective or data sets as fast as you want. The tools are here and only getting better. The only barrier now is getting everything concerning public policy into these data sets. In some ways, the process has been managed with all the bureaucratic efficiency one would expect, but what has been done is now rightfully mine to peruse and inform my vote. It's the citizens' data really, the taxpayers paid for it, and we own it. Let's take a look.

I decided to start with the phrase often heard lately: "We don't have a revenue problem, we have a spending problem." I bet if I can chart the various government expenditures, I'd agree with that. You can find the Federal Finances Dataset in the Google public data explorer Dataset Directory. I started with something simple: net outlays by year.


Yikes! It sure does look like we have a spending problem!. I also noticed how social security follows a relatively smooth upward curve, while the others have more little ups and downs. Everything's going up, except the few things everybody talks about cutting: science, education, agriculture, and energy - those programs behave the way I like my own budget, with a set price that doesn't go up every year.

Now what happens to those numbers if we compared them to the size of our economy? After all, we have more people, bigger cities, more jets, more of everything. So in terms of taking a percentage of our collective wages, what does our government look like?

Everything changes. Social Security isn't up nearly as much as I thought, the smaller programs are actually down, and the only thing that's really going up is health care. Maybe it is urgent, after all, maybe we should look at reform, as opposed to the plan I like to call repeal-and-replace-maybe-later-if-we-get-around-to-it.

Other than health care, really, the only spending problem we have is that we have to spend less and less every year. That's not how most people people like to manage their household finances, is it?

Now, how about those taxes? If we can prove we have a spending problem, we can conversely prove that we do not have a revenue problem, simply by charting the taxes with a few clicks of the mouse.


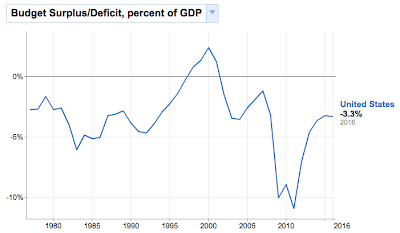
There's the revenue, and in terms of how big a piece of our pie it's around 20 percent, maybe less. I notice income tax - both personal and corporate - rise and fall relative to the state of the economy, while social security and the others (not shown here) have kept relatively steady. The peak revenue overall was 20% in 2000, which coincides with the peak budget surplus.

The point is, if I'm going to look at these issues and form opinions, let alone vote and try to convince others to vote with me, I better to do it with data. Whatever conclusions I ultimately reach, I'm going to know more with it than without it. That's probably the best I can do. Twitizen @abuaardvark once tweeted, "Sometimes I feel like the entire Internet is an exercise in documenting confirmation bias theory," or, as noted Wrongologist Kathryn Shulz points out, being wrong about something doesn't actually feel bad. It's only realizing you're wrong that feels bad.


Wednesday, April 13, 2011

Health Information System as Data Conduit

A health information exchange is a device that moves medical information from one authorized entity to another. Ultimately, these "authorized entities" are people who need to examine medical records, but an authorized entity may also refer to a device, for example a computer you use to manipulate and work with medical records. Anything that holds a copy for a period of time falls under this category and must therefore follow the rules. Secure transmission is essentially a solved problem, and may be treated in a separate data transmission layer. While consent and authorization rules may get complicated, at any given time an entity may or may not have authorization to view a piece of medical information. When you request protected health information (PHI) it is delivered from a repository to you, across a network. While you are working with the PHI, you keep a copy in your sphere of control. The data exists in its secure repositories, and in your immediate control, and nowhere in between.

Anywhere PHI may be stored and used must be secure. Yes, it's great to have all that important information zipping around everywhere, but first, do no harm.

This is a diagram of the basic information flow.


When you want to work with a patient's medical record, you request a copy from a repository (maybe more than one) and it is delivered from the repository to you without leaving a trace anywhere in between. No copies, no caching, nothing. When you're done, all that PHI disappears completely from you local system, leaving only those copies stored in secure repositories within the health care system.

A health care professional (provider) is authorized to view a particular piece of PHI for a period of time. When a device or person becomes "de-authorized" to view a record, for example when a provider "logs out," then that PHI should be gone, leaving nothing of itself anywhere in the system. If a patient changes providers, then the consent rules change accordingly. Most commonly, consent is given for a finite period of time and will expire unless explicitly renewed. (This medical record will self-destruct on July 13, 2011.) PHI always exists in the secure repository and the patient, that is to say the person whose medical record it is (the "owner" of that medical record), is permanently authorized to handle the PHI and give or take away consent.

An ideal medical record, therefore, knows who is and isn’t authorized to see it at any given time, and is kind enough to politely decline to be transmitted or remove itself from an unauthorized system.

Thursday, April 7, 2011

On Demand CCDs: Continuity of Care

At Axolotl, we dynamically generate template based CDA documents from various data sources.


One commonly transmitted document is the CCD, or Continuity of Care Document. This is a summary document, its intended purpose to have enough information, well organized, to preserve the continuity of patient care between different care providers.


The way I approach template-based CDA is to first look at the document as a container for health data, and construct the empty container first.

You can see it has, first, the necessary meta-data. Source, destination, attribution, author, the time period this document covers, any confidentiality instructions, and other information about this document.


Then it has the patient demographics and a list of all healthcare providers involved in the care described, and all doctors who provided care during the covered period.


The largest part is the clinical information itself. This document is a container, and the clinical section is meant to contain a list of clinical sections.

A section can be thought of as a smaller CDA entity in and of itself, and just as the document is composed of smaller pieces. It has template identifiers, a title, a human readable narrative text in an html-like format, and a number of entries. Each entry represents a single clinical event.

You can subclass the section into the different categories of clinical information, thereby putting a complete summary into a list of clinical sections.


The entries, themselves, have a wide variety of forms, so we subclass them into different types of entries for the various sections, support entries for the support section, insurance plan entries for the payers section, allergy entries for the alerts section, and so on.


If you need to build a CCD, or any template-based CDA document, that’s an approach to think about.